An artists journey

Tag: digital photography

  • Out of Gamut

    Out of Gamut

    That seems like a strange thing to say. It’s not a phrase you hear in normal conversation. What can it mean? I have written some about how sensors capture color, but I realize I have not mentioned the gnarly problem of color gamut. Unfortunately, I have been bumping into the problem lately, so I had to re-familiarize myself with it. Some of my new work is seriously out of gamut.

    What does gamut mean

    Most writers avoid this or give overly simplified descriptions. I’m going to treat you as adults, though. If you really are someone who is completely afraid of technology you might want to skip to the end – or ignore the whole subject.

    The concept of gamut is really pretty simple, but you need some specialized knowledge and you have to learn some new things about the world.

    I have mentioned the CIE-1931 Chromaticity Diagram before. That sounds scary, but you have probably seen the familiar “horseshoe” diagram of colors. I recommend you watch this video to understand how it was derived and what it means. This is the diagram:

    CIE-1931 Chromaticity Diagram

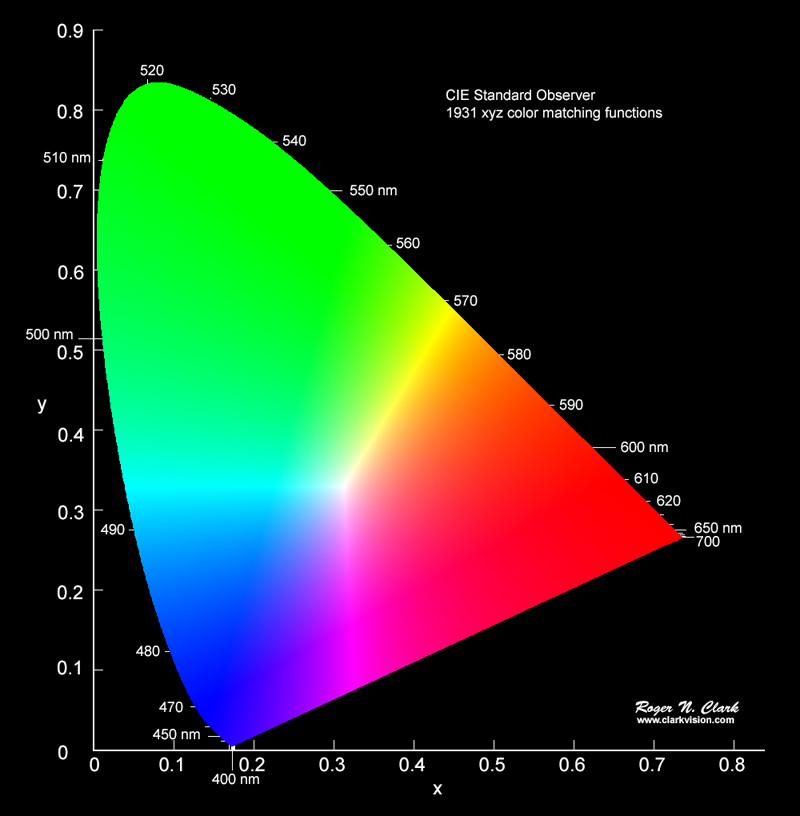
    After a lot of research and a lot of measurement, scientists determined that this represents all possible colors a typical human can see. Just the hue – color – not the brightness.

    Very simply, a gamut is just a representation of what part of this spectrum a particular device can reproduce or capture.

    Show me

    The next figure shows the horseshoe with some regions overlayed on it.

    Add ProPhoto colour space as a "working color space" - Which feature do you need? - DxO Forums

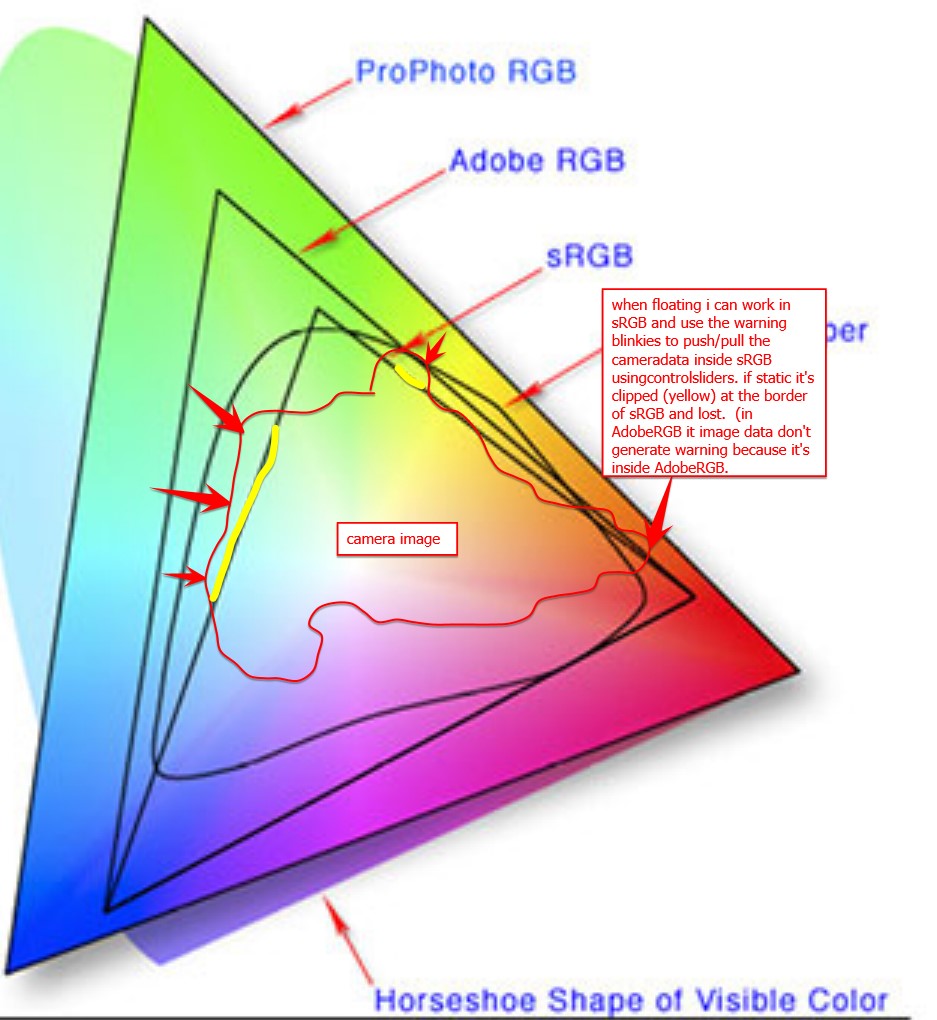
    There are 3 triangular regions labeled: sRGB, Adobe RGB, and ProPhoto RGB. They are called color spaces. The diagram is indicating all possible colors that each color space can represent. The smallest one, sRGB, is typical of a computer monitor. It is what will be used when you share a jpg image with someone. It is small but “safe”. We lose a lot of possible colors, but everyone sees roughly the same thing on all their monitors.

    Let’s jump to ProPhoto RGB. You can see that it covers the largest part of the horseshoe. In other words, ProPhoto RGB has the largest gamut. It is the best we have for representing image color and most professional photographers use this now. Unless they are doing weddings. That is a different world.

    They’re not ideal?

    Unfortunately, these color spaces are an ideal. The ProPhoto color space is a model for editing images. No actual devices or printers can give us the entire ProPhoto RBG gamut. Not even close. Most can barely do sRGB.

    Here is a diagram of the color space a Canon pro printer can do.

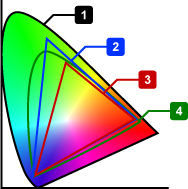
    The small horseshoe, labeled 4, is the printer gamut. It is larger then sRGB (3) and, overall, a lot like AdobeRGB (2). Smaller than ProPhoto RGB, which is not listed here.

    It looks pretty good, and in general it is. I use one of these printers. But look at what it does not do. Most greens and extremes of cyan and blue and purple and red and orange and yellow cannot be printed. Actually, almost no extremely saturated colors can be printed.

    And it is not just printers. Most monitors, even very good ones, are somewhere between sRGB and AdobeRGB spaces. This cannot really be considered a fault of the monitors or printers. The physics and engineering and cost considerations prohibit them from covering the full ideal range.

    Any of these colors that I use in an image, that can’t be created by the device I am using, are referred to as “out of gamut”. Outside of the color space the device can produce. This is what I have been running in to lately.

    What happens

    So what happens when I try to print an image with out of gamut colors? Well, it is not like it blows up or leaves a hole in the page instead of printing anything. Printers and monitors do the best they can. They “remap” the out of gamut colors to the closest they can do. As artists, we have some control over that process, as we will see in the next section.

    But the reality is that these out of gamut colors will lose detail, be washed out and without tonal contrast. When we get to looking at the print, we will say “yech, that is terrible”. Then we need to do something about it.

    What can we do about it

    There are things to do to mitigate the problem. Here is where we need to understand enough about the technology to know what to do.

    First, we have tools to help visualize the problem. Both Lightroom Classic and Photoshop have a Soft Proof view. It will simulate the actual output for a particular printer and paper. You can also view gamut clipping for the monitor. Yes, because of gamut problems you may not be seeing the image’s real color information on your monitor.

    Both Lightroom and Photoshop have versions of saturation adjustments and hue adjustment. These can help bring the out of control colors back into a printable or viewable range. With practice we can learn to tweak these settings to balance what is possible with what we want to see.

    But even if we give up and decide to print images with out of gamut colors, there are options. the print settings have a great feature called “rendering intent”. They are a way to give guidance to the print engine on how we want it to handle these wild colors. Several different rendering intents are available, but the 2 that are most commonly used are Relative and Perceptual.

    Rendering Intents

    I use Perceptual intent most often, at least in situations where the are significant out of gamut colors. Using the Perceptual directive signifies to the print driver that I am willing to give up complete tonal accuracy for a result that “looks right”. The driver is free to “squish” the color and tone range in proportional amounts to scale the whole image into a printable range. I don’t do product photography or portraits, so I am usually not fanatical about absolute accuracy. How they work this magic is usually kept as a trade secret. But secret or not, it often does a respectable job of producing a good output.

    The other common intent is Relative. This basically prints the data without modification, except that it clips out of gamut colors. That sounds severe, but the reality is that most natural scenes will not have any significant gamut problems, so no clipping will occur.

    This is a great intent for most types of scenes, because no tonal compression will take place.

    The answer

    The answer is “your mileage may vary”. Most images of landscapes and people will not have serious out of gamut problems. When you do, this information may help you get the results you want. When you have a problem, turn on the soft proofing and try the Relative and Perceptual rendering intents. Look at the screen to see if one is acceptable. If not, go back and play with saturation and colors .

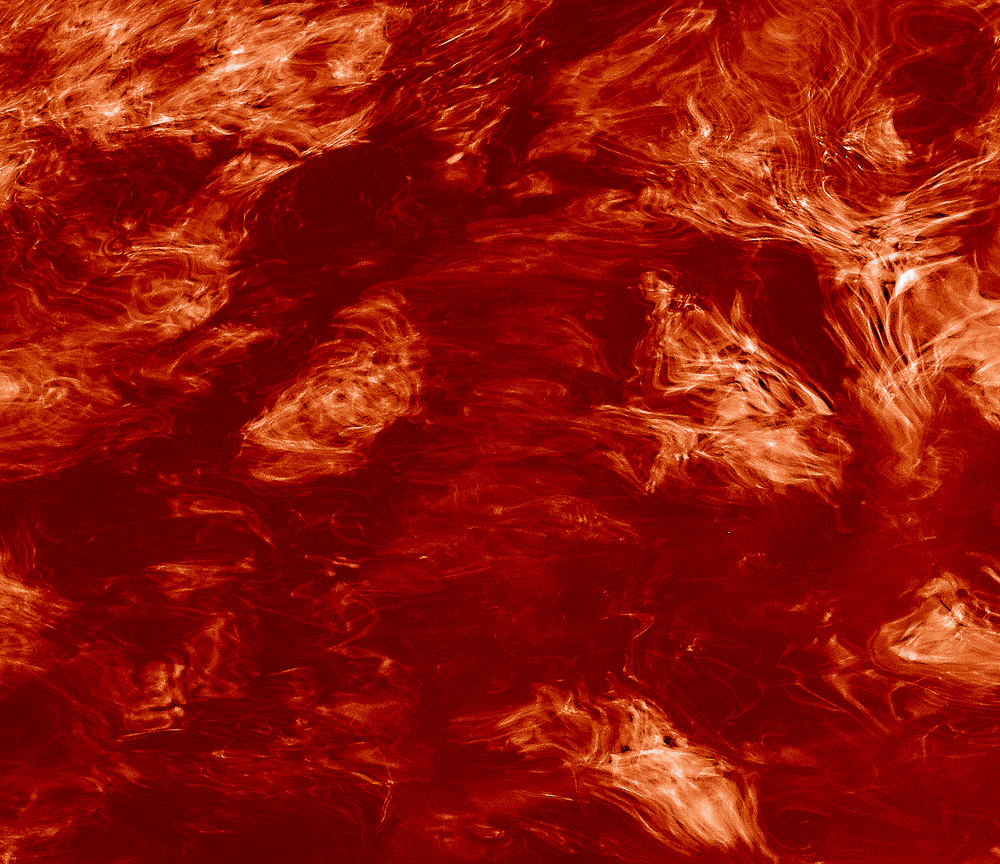
    Why do I have problems? Well, I’m weird. I have been gravitating to extremely vibrant, highly saturated images. I like the look I am trying to get, but it can be hard to get it onto a print. The image at the top of this article is a slice of an image I am working with now. It is seriously out of gamut. I need to work on it a lot more to be able to print it without loss of color detail. Ah, technical limitations.

  • Is Scaling Bad?

    Is Scaling Bad?

    I have written about image sharpness before, but I was challenged by a new viewpoint recently. An author I respect made an assertion that gave me pause. He was describing that when you enlarge film it is an optical scaling but digital enlarging requires modifying the information. Implying that modifying information was bad. So I was wondering, is digital scaling bad?

    Edges and detail

    Let me get two things out of the way. When we are discussing scaling we only mean upscaling, that is, enlarging an image. Shrinking or reducing an image size is not a problem for either film or digital.

    The other thing is that the problems from upscaling mostly are edges or fine detailed areas. An edge is a transition from light to dark or dark to light. The more resolution the medium has to keep the abruptness of the transition, the more it looks sharp to us. Areas with gradual tone transitions, like clouds, can be enlarged a lot with little degradation.

    Optical scaling

    As Mr. Freeman points out, enlarging prints from film relies on optical scaling. An enlarger (big camera, used backward) projects the negative on to print paper on a platen. Lenses and height extensions are used to enlarge the projected image to the desired size.

    This is the classic darkroom process that was used for well over 100 years. It still is used by some. It is well proven.

    But is is ideal? The optical zooming process enlarges everything. Edges become stretched and blurred, noise is magnified. It is a near exact magnified image of the original piece of film. Unless it is a contact print of an 8×10 inch or larger negative, it has lost resolution. Walk up close to it and it looks blurry and grainy.

    Digital scaling

    Digital scaling is generally a very different process. Scaling of digital images is usually an intelligent process that does not just multiply the size of everything. It is based on algorithms that look at the spatial frequency of the information – the amount of edges and detail – and scales to preserve that detail.

    For instance, one of the common tools for enlarging images is Photoshop. The Image Size dialog is where this is done. When resample is checked, there are 7 choices of scaling algorithms besides the default “Automatic”. I only use Automatic. From what i can figure out it analyzes the image and decides which of the scaling algorithms is optimal. It works very well.

    All of these operations modify the original pixels. That is common when working with digital images and it is desirable. As a matter of fact, it is one of the advantages of digital. A non-destructive workflow should be followed to allow re-editing later.

    Scaling is normally done as a last step before printing. The file is customized to the final image size, type of print surface, and printer and paper characteristics. So it is typical to do this on a copy of the edited original. In this way the original file is not modified for a particular print size choice.

    Sharpening

    In digital imaging, it is hard to talk about scaling without talking about sharpening. They go together. The original digital image you load into Lightroom (or whatever you use) looks pretty dull. All of the captured data is there, but it doesn’t look like what we remembered, or want. It is similar to the need for extensive darkroom work to print black & white negatives.

    One of the processes in digital photography in general, and after scaling in particular, is sharpening. There are different kinds and degrees of sharpening and several places in the workflow where it is usually applied. It is too complex a subject to talk about here.

    But sharpening deals mainly with the contrast around edges. An edge is a sharp increase in contrast. The algorithms increase the contrast where an edge is detected.

    This changes the pixels. It’s not like painting out somebody you don’t want in the frame, but it is a change.

    By the way, one of the standard sharpening techniques is called Unsharp Mask. It is mind-bending, because it is a way of sharpening an image by blurring it. Non-intuitive. But the point here is this is digital mimicry of a well known technique used by film printers. So the old film masters used the same type of processing tricks to achieve the results they wanted. They even spotted and retouched their negatives.

    Modifying pixels

    Let me briefly hit on what I think is the basic stumbling block at the bottom of this. Some people have it in their head that there is something wrong or non-artistic about modifying pixels. That is a straw man. It’s as silly as saying you’re not a good oil painter if you mix your colors, since they are no longer the pure colors that came out of the tubes. I have mentioned before that great prints of film images are often very different from the original frame. Does that make them less than genuine?

    Art is about achieving the result you want to present to your viewers. How you get there shouldn’t matter much, and any argument of “purity” is strictly a figment of the objector’s imagination.

    One of the great benefits of digital imaging is the incredible malleability of the digital data. It can be processed in ways the film masters could only dream of. We as artists need to use this capability to achieve our vision and bring our creativity to the end product.

    I am glad I live in an era of digital imaging. I freely modify pixels in any way that seems appropriate to me.

  • The Making of “Nothing Is Quite What It Seems”

    The Making of “Nothing Is Quite What It Seems”

    Today I’m going to discuss the making of this image. I created this abstract image titled “Nothing Is Quite What It Seems” from disparate elements put together to achieve the surreal landscape effect I wanted.

    But as the title suggests, nothing is what it seems to be.

    Base, Idea

    When i saw the thing creating the basic silhouette shapes I knew it needed to be a scene of dead trees in a barren landscape. In reality, though, these shapes are actually cracks in ice on a frozen lake in Colorado.

    I framed the scene up to isolate these 2 cracks that looked the most to me like dead trees. The “brush” in the foreground is the near edge of the ice, looking through to some rocks close under the surface.

    The processing required some touch-up editing and some dodge and burn and contrast enhancement. There was a little hue-saturation enhancement to bring out more of the yellow rocks.

    All of this was done as a smart object in Photoshop. Because I wanted to keep my options open I use smart objects a lot. They give me the freedom to come back and continue editing later. I don’t like to commit permanent changes.

    Texture

    With the basic form set, I started building texture. Tone adjustments in the smart object of the base layer helped. Bringing up the contrast brought forward more of the texture of the ice. This is the dimples and spots all over the image.

    To abstract it a little more I used the oil paint filter in Photoshop to soften the edges and give it a more painterly and abstract look.

    Color treatment

    I knew I wanted to change the color palette and make it look like it could be in an abandoned homestead on the Colorado plains. But I also wanted to layer on more interesting texture. After trying many overlays I settled on a beautiful rusty truck panel. The image I used is part of a 1948 Coleman Truck. Pretty rare, and it was aging beautifully.

    The truck had large rust patterns and also areas of old yellow and green paint. Using this to establish the colors across the image worked for me. This truck overlay is also handled as a smart object. Careful blending achieved the look I wanted without it looking like a rusty truck.

    Finishing

    The final polishing and tweaking takes a lot of time, even though it doesn’t make sweeping changes. As we used to say in software development, the first 90% of the project takes 100% of the schedule. The last 10% takes the other 100% of the schedule.

    There was final dodging and burning to do, bits of masking and retouching. Of course, there was a little bit of final color tweaking to my satisfaction. One of the reasons I use a flexible workflow is that I am prone to tweak things after I have looked at them a while.

    Process

    A comment on my workflow. Although this is a fairly complex image, nothing is permanently locked down or committed. While writing this I was able to open up all the layers and smart objects and see everything about how they were processed. I could still go in and change or modify anything in the image. And I did make some tweaks. I told you I can’t leave images alone.

    And as a very experienced Photoshop user I know new tools will be developed and I will learn new ways of doing things. These will lead to new ways to process images that I will want to take advantage of in the future.

    This is the way I choose to work this way on most of my images. It doesn’t take longer and it preserves total flexibility. I need that. I change my mind often!

    Summary

    I like the finished image. It seems to be a surreal Colorado landscape of dead trees, but it contains no trees or plains or anything else that it appears to be. It is truly not quite what it seems. Is this more interesting than a straight shot of the ice?

    Lightroom and Photoshop are powerful and addictive tools. Know when to use them and know when to stop. Otherwise you may never stop. It’s a great time to be doing imaging.

  • How We Get Color Images

    How We Get Color Images

    Have you ever considered that that great sensor in your camera only sees in black & white? How, then, do we get color images? It turns out that there is some very interesting and complicated Engineering involved behind the scenes. I will try to give an idea of it without getting too technical.

    Sensor

    I have discussed digital camera sensors before. They are marvelous, unbelievably complicated and sophisticated chips. But they are, still, a passive collector of photons (light) that falls on them.

    An individual imaging site is a small area that collects light and turns it into an electrical signal that can be read and stored. The sensor packs an unimaginable number of these sites into a chip. A “full frame” sensor has an imaging area of 24mm x 36mm, approximately 1 inch by 1.5 inch. My sensor divides that area into 47 million image sites, or pixels. It is called “full frame” because that was the historical size of a 35mm film frame.

    But, and this is what most of us miss, the sensor is color blind. It receives and records all frequencies in the visible range. In the film days it would be called panchromatic. That is just a fancy word to say it records in black & white all the tones we typically see across all the colors.

    This would be awesome if we only shot black & white. Most of us would reject that.

    Need to introduce selective color

    So to be able to give us color, the sensor needs to be able to selectively respond to the color ranges we perceive. This is typically Red, Green, and Blue, since these are “primary” colors that can be mixed to create the whole range.

    Several techniques have been proposed and tried. A commercially successful implementation is Sigma’s Foveon design. It basically stacks three sensor chips on top of each other. The layers are designed so that shorter wavelengths (blue) are absorbed by the top layer, medium wavelengths (green) are absorbed by the middle layer, and long wavelengths (red) are absorbed by the bottom layer. A very cleaver idea, but it is expensive to manufacture and has problems with noise.

    Perfect color separation could be achieved using three sensors with a large color filter over each. Unfortunately this requires a very complex and precise arrangement of mirrors or prisms to split the incoming light to the three sensors. In the process, it reduces the amount of light hitting each sensor, causing problems with image capture range and noise. It is also very difficult and expensive to manufacture and requires 3 full size sensors. Since the sensor is usually the most expensive component of a camera, this prices it out of competition.

    Other things have been tried, such as a spinning color wheel over the sensor. If the exposure is captured in sync with the wheel rotation then 3 images could be exposed in rapid sequence giving the 3 colors. Obviously this imposes a lot of limitations on photographers, since the rotation speed has to match the shutter speed. A real problem for very long or very short exposures or moving subjects.

    Bayer filter

    Thankfully, a practical solution was developed by Bryce Bayer of Kodak. It was patented in 1976, but the patent has expired and the design is freely used by almost all camera manufacturers.

    The brilliance of this was to enable color sensing with a single sensor by placing a color filter array (CFA) over the sensor to make each pixel site respond to only one color. You may have seen pictures of it. Here is a representation of the design:

    Bayer Filter Array, from Richard Butler, DPReview Mar 29, 2017

    The gray grid at the bottom represents the sensor. Each cell is a photo site. Directly over the sensor has been placed an array of colored filters. One filter above each photo site. Each filter is either red or green or blue. Note that there are twice as many green filters as either red or blue. This is important.

    But wait, we expect that each pixel in our image contains full RGB color information. With this filter array each pixel only sees one color. How does this work?

    It works through some brilliant Engineering with a bit of magic sprinkled in. Full color information for each pixel is constructed by interpolating based on the colors of surrounding pixels.

    Restore resolution

    Some sophisticated calculations have to be done to calculate the color information for each pixel. This makes each pixel end up with full RGB color values. The process is termed “demosaicking” in tech speak.

    I promised to keep it simple. Here is a very simple illustration. In the figure below, if we wanted to derive a value of green for the cell in the center, labeled 5, we could average the green values of the surrounding cells. So an estimate of the green value for cell red5 is (green2+green6+green8+green4)/4

    From Demosaicking: Color Filter Array Interpolation, IEEE Signal Processing Magazine, January 2005

    This is a very oversimplified description. If you want to get in a little deeper here is an article that talks about some of the considerations without getting too mathematical. Or this one is much deeper but has some good information.

    The real world is much more messy. Many special cases have to be accounted for. For instance, sharp edges have to be dealt with specially to avoid color fringing problems. Many other considerations such as balancing the colors complicate the algorithms. It is very sophisticated. The algorithms have been tweaked for over 40 years since Mr. Bayer invented the technique. They are generally very good now.

    Thank you, Mr. Bayer. It has proven to be a very useful solution to a difficult problem.

    All images interpolated

    I want to emphasize a point that basically ALL images are interpolated to reconstruct what we see as the simple RGB data for each pixel. And this interpolation is only one step in the very complicated data transformation pipeline that gets applied to our images “behind the scenes”. This should take away the argument of some of the extreme purists who say they will do nothing in post processing to “damage” the original pixels or to “create” new ones. There really are no original pixels.

    I understand your point of view. I used to embrace it, to an extent. But get over it. There is no such thing as “pure” data from your sensor, unless maybe you are using a Foveon-based camera. All images are already interpolated to “create” pixel data before you ever get a chance to even view them in your editor. In addition profiles and lens corrections and other transformations are applied,

    Digital imaging is an approximation, an interpretation of the scene the camera was pointed at. The technology has improved to the point that this approximation is quite good. Based on what we have learned, though, we should have a more lenient attitude about post processing the data as much as we feel we need to. It is just data. It is not an image until we say it is, and whatever the data is at that point defines the image.

    The image

    I chose the image at the head of this article to illustrate that the Bayer filter demosaicking and other image processing steps gives us very good results. The image is detailed and with smooth, well defined color variation and good saturation. And this is a 10 year old sensor and technology. Things are even better now. I am happy with our technology and see no reason to not use it to its fullest.

    Feedback?

    I felt a need to balance the more philosophical, artsy topics I have been publishing with something more grounded in technology. Especially as I have advocated that the craft is as important as the creativity. I am very curious to know if this is useful to you and interesting. Is my description too simplified? Please let me know. If it is useful, please refer your friends to it. I would love to feel that I am doing useful things for people. If you have trouble with the comment section you can email me at ed@schlotzcreate.com.

  • The Histogram

    The Histogram

    Please permit me to rant briefly. I get incensed by the practice of most photo instructors to “dumb down” what we do. They assume people are incapable or afraid of anything technical. So they give a very short and often unintelligible description of something we, as photographers need to know, then go on. One example of this is the lowly histogram.

    I’m sorry to have to tell you, but all art has a technical component to it. Photography is one of the most technical.

    The histogram is like taking your temperature or looking at a graph of your portfolio performance. It is data that does not mean anything in itself but it is very useful to check. In this case, the histogram is just a measure of our image. It is valuable, but it is only one of many possible measures.

    What I hope to do here is do what your dad probably did (or should have done) in this situation – tell you to get over it. You need to know this, so get on with it. 🙂

    Not high tech

    The histogram is not a complex, fancy piece of technology. It is just counting and marking.

    Let’s say for simplicity that your image is black & white and is 8 bit depth. You know that this means the image is a grid of pixels, each having a value of 0-255. Now you decide to go through each pixel one at a time and keep track of a count of each pixel value you find. You come to a pixel that has the value 87. Go to your row of 87’s and increment it by one. You know, like

    Keep on going. If the next pixel is 127, go and increment the count for that bucket.

    After you count the values of all the pixels, you will have up to 256 groups of counts. Now, draw a graph (technically a column chart) or put the data in Excel and have it graph it. If you put the numbers 0-255 on the x axis (the horizontal line) and draw a point above each number corresponding to the count you made for that number, you will have a histogram.

    That’s all it is, just a count of the number of each pixel value. The actual number in each bin does not matter. What counts is the overall shape of the curve.

    An example

    Here is a fairly balanced black & white image and its histogram.

    People would call this a “good” histogram. It shows that the tones have counts from very close to 0 to almost 255, a full range from black to white The tones are spread fairly evenly. There is a bump in the distribution of the light tones – the right side- which is natural because there are big areas of snowfields and light gray clouds.

    There is no magic. You could manually follow the pattern I described and derive this yourself. It doesn’t “mean” anything of itself. It is just a way to get some information about your image.

    Descriptive, not prescriptive

    This is where people get confused, partly because they are misled by their instructors. The histogram does not tell you if you have a good or bad image. The histogram is descriptive, not prescriptive. That is, it is just information for you. It does not grade your image or tell you you exposed it wrong.

    IN GENERAL, if your histogram shows values bunched up far at the left or far at the right, that is a warning sign. It is telling you the image may be too underexposed or over exposed. Those values at the extremes show that you may be losing data that cannot be recovered.

    Whenever you see this situation it is a warning flag, not a stop sign. It may be necessary for the effect you want.

    Expose To The Right example

    You often hear the advice to “expose to the right“. This is good advice in general. It means bias your exposure higher – more histogram to the right – as long as there is no clipping of the highlights. This is because of some of that scary technical stuff you need to know. The dark areas of an image are more subject to noise. If you have to boost the dark areas that magnifies the noise. The best results are often obtained by overexposing a little and reducing the exposure of the whole image in post processing. Digital data retains more information when you are scaling it down than when you are scaling it up.

    Expose to the right is an example of a good way to use histograms. I always have the histogram view turned on in my viewfinder. As a matter of fact, possibly the single best reason to go to mirrorless cameras is to be able to get a real-time histogram. I always check it, before and after taking a frame.

    Let me emphasize again that this is information for you to use and make your own judgment. Do not let the histogram take your pictures. Keep artistic control.

    Yours can look anyway you want

    It is not unusual for me to shoot images that have a “bad” histogram. When I do this it is deliberate and I do not have to answer to the data police (yet).

    One class of very low key images is night photography. Often these are nearly all dark with only a few points of light. This is an example:

    It is hard to see at this size, but you can tell what is important from the histogram. Most data is clustered at the dark end. There is a spike at the brightest whites. These are the stars. Your instructor would tell you it is not a good histogram, but the image is exactly what I wanted. An image is properly exposed if it comes out the way you want.

    At the other extreme, a high key image is almost all white. This fence in a snowy field is almost all bright values:

    The distribution (the arrangement of the data values) is skewed way to the right, but not overexposed. But there is a spike at the left representing the black fence posts. Very high contrast. This is the result I wanted, so it is correct.

    These 2 examples of “wrong” exposures should broaden your understanding of what is allowed. Anything that matches your intent is a properly done image.

    A great tool, but just a tool.

    I hope I have given you a better feel of what a histogram represents. It is just an overall look at the data values in the image. It is there for information to help you make the images you want. A histogram is neither good or bad. It is just information. Other people have given their own interpretation of histograms and their importance. This is a good one.

    I am very thankful for the invention of histograms and their availability in modern cameras and post processing tools. It is an indispensable tool. I use them every day. But remember it is a tool. It is not there to tell you what you can do. You are the artist. Only you can decide the result you want.